SILO 3.1 (DRAFT)Year 3, Term 1: CommunicationFocus: Multimodality Scope and sequence: Flowcharts, Iteration, Multimodality |
|
Learning
intention: Students
demonstrate their understanding of STEM concepts using
multimodality which has been customised for different
audiences.
|
|
|
NSW Syllabus
|
Australian Curriculum
(version 9.0)
|
|
"A student plans and conducts
scientific investigations to answer testable questions, and
collects and summarises data to communicate conclusions."
(ST3-1WS-S)
|
"Students write and create texts
to communicate findings and ideas for identified purposes and
audiences, using scientific vocabulary and digital tools as
appropriate." (AC9S3I06)
|
Introduction to communication
What is science communication?
Science communication is the concept of getting scientific knowledge
across to non-expert audiences, ensuring the information can be
understood by those without background information. By doing this, the
presenter is able to demonstrate their own understanding by teaching
others and can use a variety of different means and media to do so.
Key components of good science communication
To better understand what goes into the effective communication of
scientific concepts, let’s break it down by imagining that we are baking
a cake. The end result (the cake) will be the successful communication
of the science, and every ingredient that goes into the cake will be an
important characteristic of the communication method.
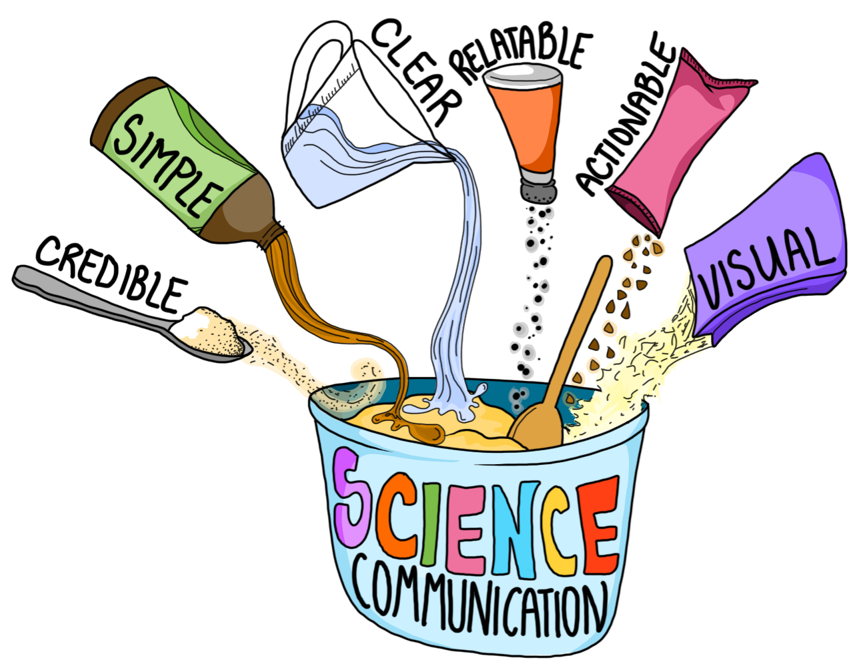
- Is the information I am presenting accurate and credible?
- Is it simple enough that those without a scientific background can understand it?
- Is the message clearly understandable?
- Is it explained in a way that the audience can relate to?
- Can the audience see the actionable, practical value of the information?
- Is it visually understandable to aid in the explanation?
Activity:
Your task is to use art as a means of communicating the scientific
process that caterpillars follow as they turn into butterflies. Assume
the audience (us!) has never heard of this process before. The materials
you can use for your art project are:
- Blank paper
- Coloured paper
- Coloured pencils
- Tape
Students will have 20 minutes to complete their piece and then will present to the class
Flowcharts
An important idea in this unit is that a flowchart
can be used whether or not an experiment or procedure is carried out.
For example, the logical behind the following flowchart about lamps
makes sense even if you don't have a broken lamp to repair.
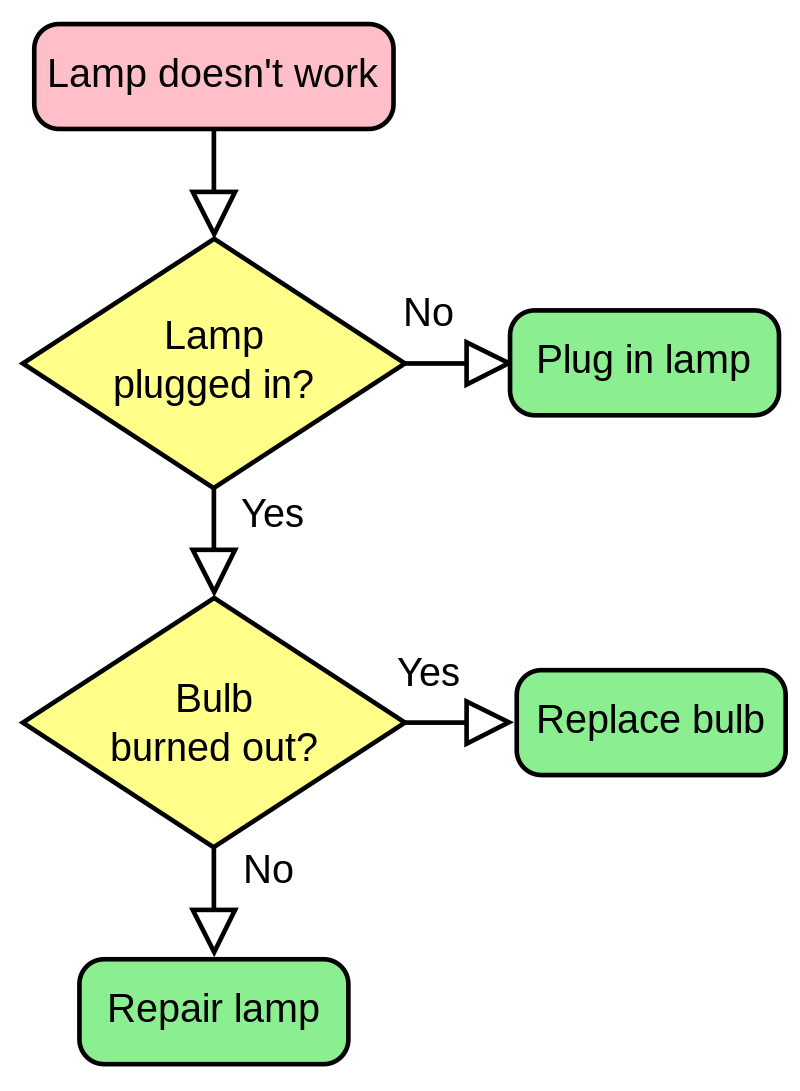
(Image source: https://en.wikipedia.org/wiki/Flowchart#/media/File:LampFlowchart.svg)
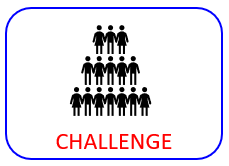
The following chart is for competitions where 16 players are reduced down to 8, 4, 2 and then 1. Your challenge is to come up with ways to incorporate more than 16 players such as 19 or 20. Most classroom have more than 16 students so think of how you could include all students using the same idea of two players competing together. A good context for this activity is the game Rock Paper Scissors.

The following video (2:25) refers to flowcharts as 'flow diagrams' but the concept is the same.
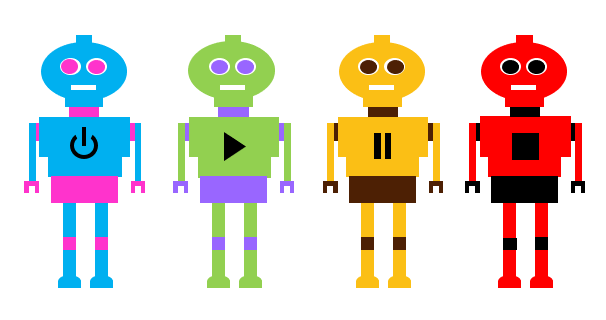
Graphic design
Repetition can be a useful idea and process when working
with graphics. The following image of four robots involved making one
robot and then duplicating it while making some small changes. The
source file for these robots involved working with auto shapes in
PowerPoint. It can be accessed here.
Using layers in PowerPoint
Grouping and ungrouping images in PowerPoint
Frame-based animation in PowerPoint
Creating frame-based animations in PowerPoint is a simple process based on the functionality of inserting duplicate slides as follows:
- Create imagery using auto shapes
- Create a duplicate slide under 'New slide' and then 'Duplicate selected slide(s)'.
- Make small changes the the new slide.
- Repeat the duplicate slide process as many times as required.
- The fastest way to render the various slides into an animation is to use screen capture.
Animation
Animations can be made efficiently using Microsoft PowerPoint or Google Slides by inserting duplicate slides and then changing the graphics. Such changes can be to the position, size and/or colour of the imagery.
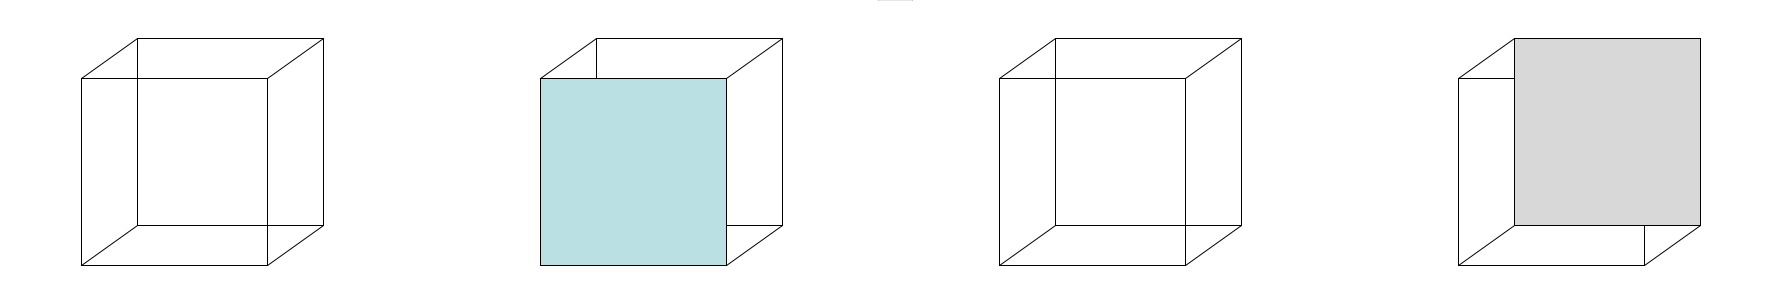
The Necker cube is an optical illusion first published in 1832 by Louis Albert Necker. It is a simple two-dimensional drawing of a cube with no visual cues as to its orientation. This means that it can be interpreted to have either the lower-left blue face or the upper-right grey face as its front side. Your challenge is to re-create this animation making the optical focus either top v bottom or left v right.
Interactive stories
By creating links using software such as Microsoft PowerPoint or web-based apps like Google Chrome, you can make interactive stories where the user can make choices to determine their own path throughout a story.
- The following example is called The Hollow Stone. Click here to begin your adventure.
- Another example is called The Adventures of Fiona the Fairy Penguin. Click here to begin your adventure.
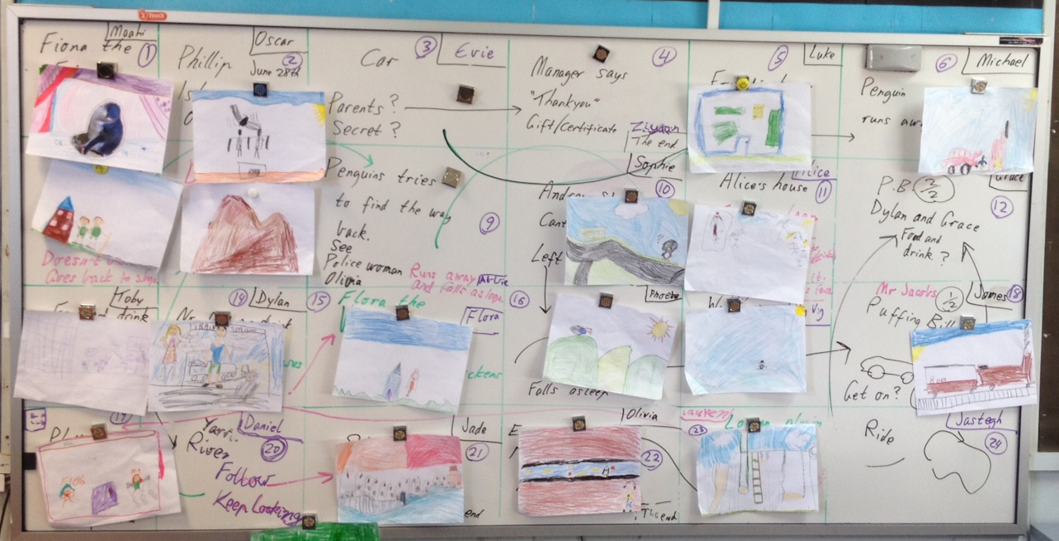
The planning for The Adventures of Fiona
the Fairy Penguin is shown below where each numbered box in the
grid is a separate frame. The arrows show how the various frames connect
with each other.
Moderated self-assessment
Discussions with students around the key components of conceptual topics and how they fit together can generate insights into student achievement.


This work is licensed under a Creative Commons Attribution-NonCommercial-ShareAlike 4.0 International License.
Main menu