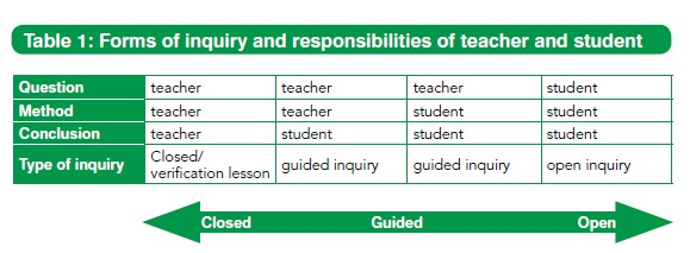
SILO 3.3 (DRAFT)Year 3, Term 3: Questioning and predictingFocus: Hypotheses Scope and sequence: Hypotheses, If-then statements, Probability, Proportionality |
|
Learning intention: Students plan and conduct scientific investigations to answer questions using representations of data. |
|
|
NSW Syllabus
|
Australian Curriculum (version
9.0)
|
|
"A
student questions, plans and conducts scientific
investigations, collects and summarises data and communicates
using scientific representations." (ST2-1WS-S)
|
"Students
learn to pose questions to explore observed patterns and
relationships and make predictions based on observations."
(AC9S3I01)
|
Introduction to questioning and predicting
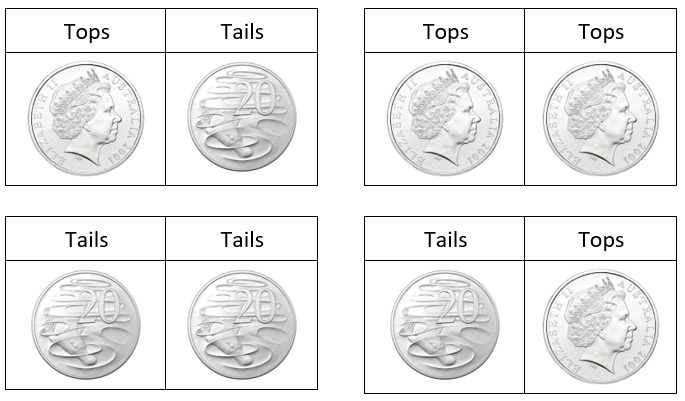
Tops and tails game
This game involves the idea of probability. It only requires two coins but it is also good to use music. The rules are as follows:
- The teacher instructs the students that they are free to move or dance around the room while the music plays.
- When the music stops the students must stop moving.
- The teacher says "Top or tails?"
- The students must place their hands on their head (top) or bottom (tail). This could be both hands on their head, both hands on their bottom, or one hand on each.
- Once they have decided they must hold this pose while the teacher tosses both coins.
- 'Heads' on the coin is tops and tails is tails.
- The teachers read out the results of the coin toss.
- Students who were in the correct pose are still 'in' but the other children are 'out' and must sit down.
- The game is repeated (and the music recommences) until a winner is revealed.
- It often works out that the remaining students exit the game at the same time. If this happens you could either declare the last ones to go out as the winners or replay that round until a winner is found.
Probability
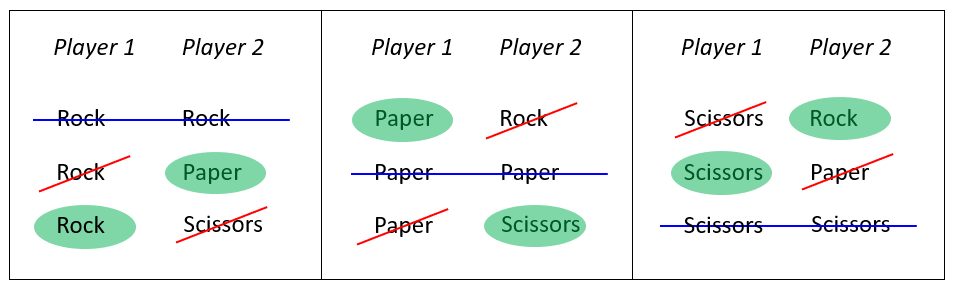
Probability refers to the likelihood of something happening. Children are already familiar with this idea when they think of the weather and how likely it is that it might rain on a cloudy day and so on. The following activity is based on the game rock, paper, scissors. Children are likely to be familiar with this but the following diagram is a reminder of which hand gesture beats the others.

Ask your students to play a few rounds of rock, paper scissors and ask them if they think that one hand gesture is more likely to win than another.
 |
How many possibilities are there is a single round of rock,
paper, scissors?
|

The
answer is 9 which is 3 (choices) to the power of 2 (players).
However, there are still 3 out of 9 scenarios where there is a
draw, 3 out of 9
scenarios where Player 1 wins, and 3 out of 9
scenarios where Player 2 wins. This means that the probability for
winning, losing or drawing are all 1 in 3.
Proportionality
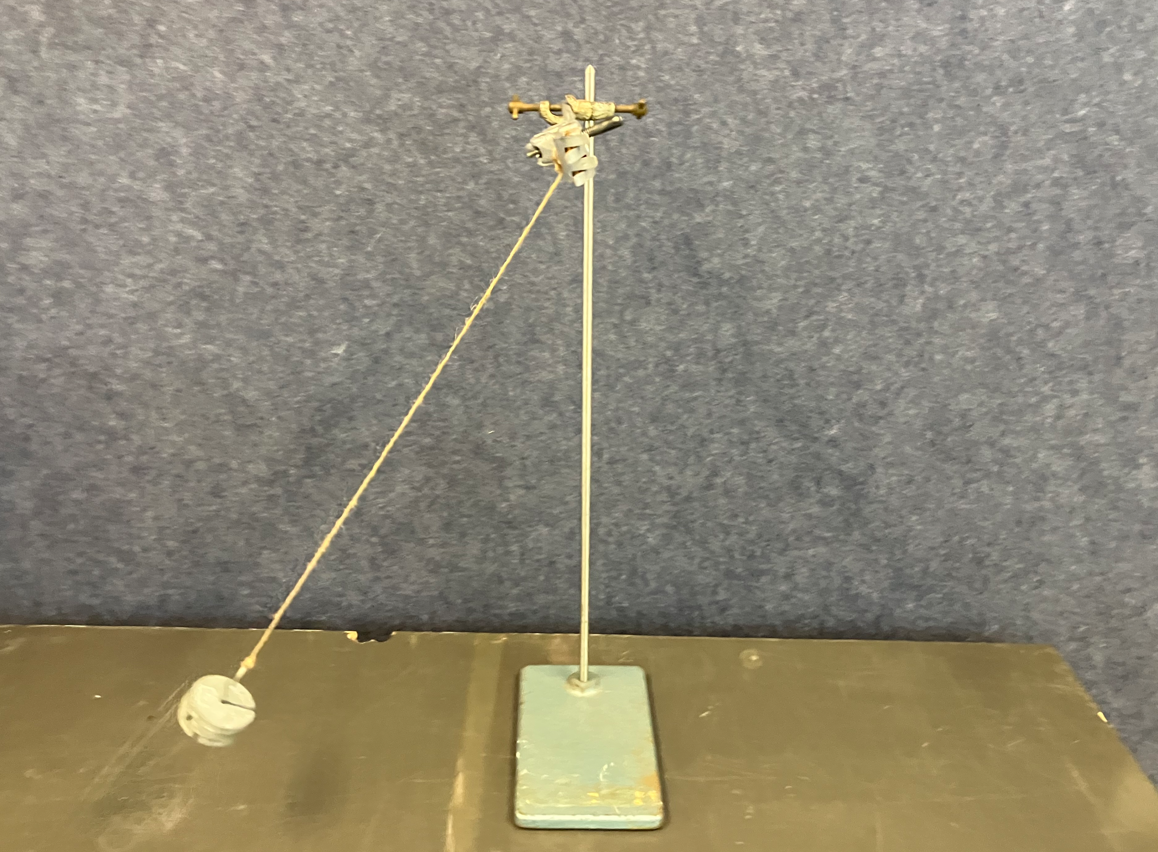
Pendulum activity
A pendulum is a weight suspended from a fixed point that swings freely back and forth under the influence of gravity. For this investigation you will need the following resources:
- string,
- various objects or weights,
- something to attach a string to,
- a stopwatch. (A classroom clock will suffice as a stopwatch if you count larger group of swings, such as 10, and then divide the total time by the number of swings.)
An A4 PDF of this investigation is available here.
 |
|
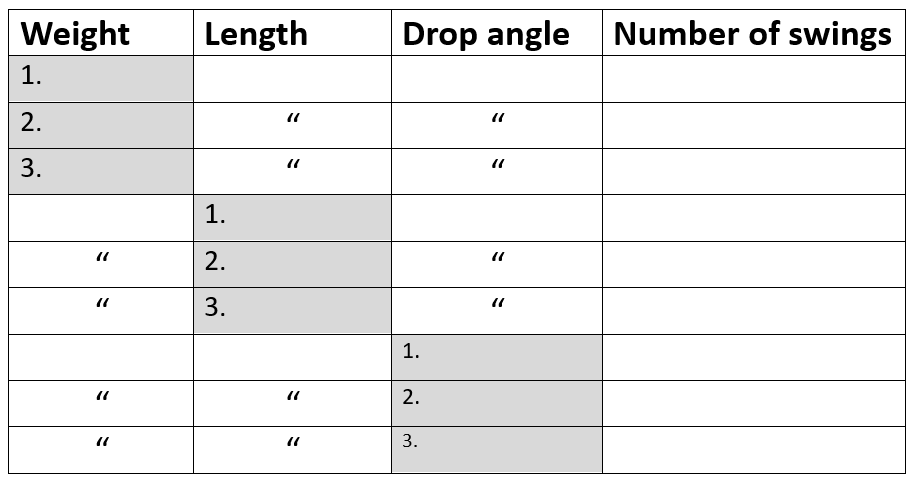
- Weight: Objects are attached the end of the string by tying them on or using tape. Commercially made weights usually have the weight printed on them. Classroom objects can simply be recorded by their name (e.g., glue stick) but students should be able to differentiate between the various informal objects according to which were the heaviest, lightest, and so on.
- Length of string: The length of the string should be measured and noted using whichever system your region uses. For Australian schools, this will be in centimetres (cm).
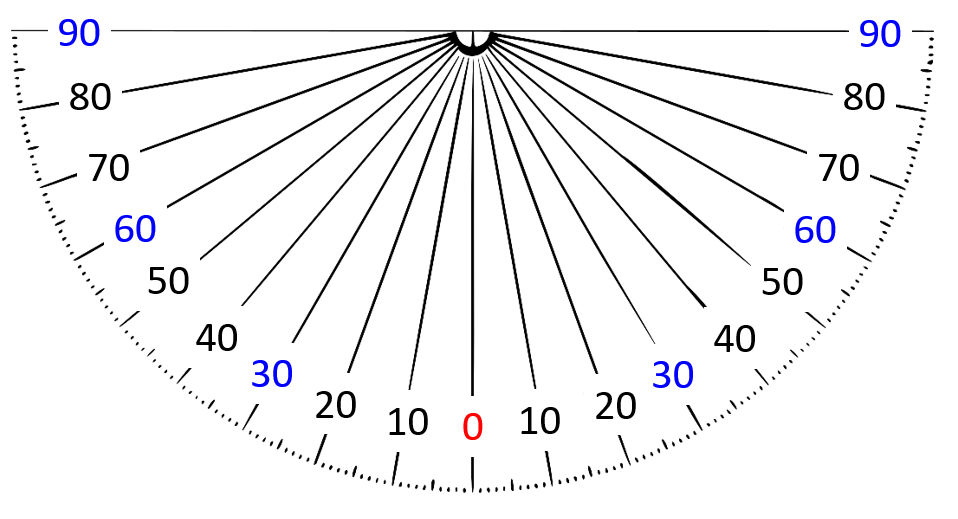
- Drop angle: The drop angle might require estimation. One way to do this is to visualise an analogue clock where the stationary point would be 6 o’clock. You could then try releasing the weight from the 5, 4 and 3 o’clock positions (if moving the weight anticlockwise) or the 7, 8 and 9 o’clock positions (if moving the weight clockwise). Each hour would equate to 30 degrees.
- Number of swings: It can be difficult to measure the
duration of a single swing so the accuracy for the duration can be
improved by averaging the time taken for multiple swings. However,
this requires students to be familiar with decimals. An easier
method is to count the number of swings during a set period of time,
such as 10 seconds. This can be counted from either the release
point or the bottom of the swing as long as a full cycle is measured
each time.
- Tip:
- Only change one variable at a time in the shaded cells for each duration measurement..
- To indicate when one of the variables has not changed we have used the ditto mark (″).
- Avoid using the ditto mark for the number of swings as this is important information so shortcuts are not recommended.
- The following table has enough rows to change the weight, length, and drop angle three times.
 |
|
|
The formula for pendulum swings uses mathematical symbols and operations which most students will have never seen before such as the square root symbol. However, thinking back to proportionality, is the length of the string directly proportional or inversely proportional to the duration of each swing? |
Hypotheses
A hypothesis is a proposed explanation which can then be used for further investigation.
https://study.com/learn/lesson/hypothesis-examples.html
If-then statements
'If-then' statements provide a useful structure for hypotheses. The following video (1:12) explains the connections between hypotheses, 'if-then' statements, and variables.
'If-then' statements are also used in coding where they can also be called 'conditional statements'. See SILO 3.4 'Coding' for examples of conditional statements.
Fair test challenge
 |
Make an
animation or slideshow using the following 10 statements for
the voice-over script.
|
- In scientific experiments a variable is something which can vary or change.
- A fair test is a controlled experiment involving an independent variable, a dependent variable and control variable(s).
- A way to remember the rules for a fair test is Cows Moo Softly. This means Change one thing, Measure one thing, and keep everything else the Same.
- The variable which we change is the independent variable because we choose to change it as the focus of an experiment.
- The variable which we measure is the dependent variable because it depends on the independent variable.
- Control variables need to kept the same to make it fair test.
- (Design a fair test.) For example, experimenting with the baking of bread could become a fair test by making changes to the proportions or process.
- (Write instructions with clearly defined variables.) This experiment…
- A hypothesis in a fair test can link the ‘if’ with the independent variable and the ‘then’ with the dependent variable.
- A hypothesis isn't about being right or wrong but about proof and falsification.
A PowerPoint file containing the voice-over
scripts is available here.
|
The 'nervous experiment' tests the sensitivity of different parts of your skin. Which parts are the most sensitive? |
This investigation is suited to students working in pairs.
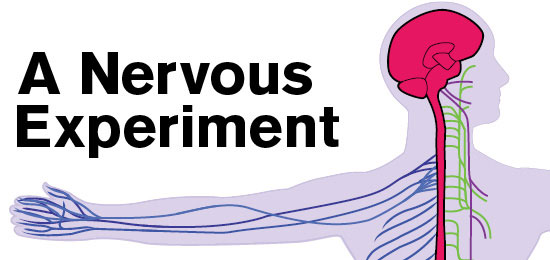
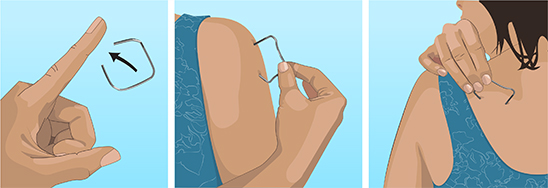
© Arizona Board of Regents / ASU Ask A Biologist.(https://askabiologist.asu.edu/experiments/nerves)
What you need for each pair of students:
- A ruler that shows centimetres.
- A paperclip (unwound so it looks like a rectangle and the ends are together)
- Paper and pencil
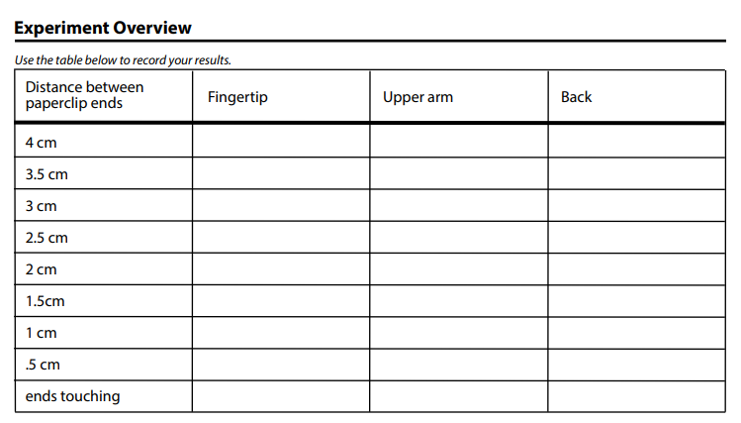
- An A4 print out of the table is available here as a PDF with two tables on each page (i.e., one page per pair of students).
© Arizona Board of Regents / ASU Ask A Biologist
|
The table above will only have the numbers 1 or 2 depending on whether the students can distinguish between 1 or 2 prongs from the paperclip. Is there any reason to average this data? |
Types of inquiry
https://www.sciencebydoing.edu.au/pre-2022-curriculum-unit-files
Moderated self-assessment
Discussions with students around the key components of conceptual topics and how they fit together can generate insights into student achievement.


This work is licensed under a Creative Commons Attribution-NonCommercial-ShareAlike 4.0 International License.
Main menu